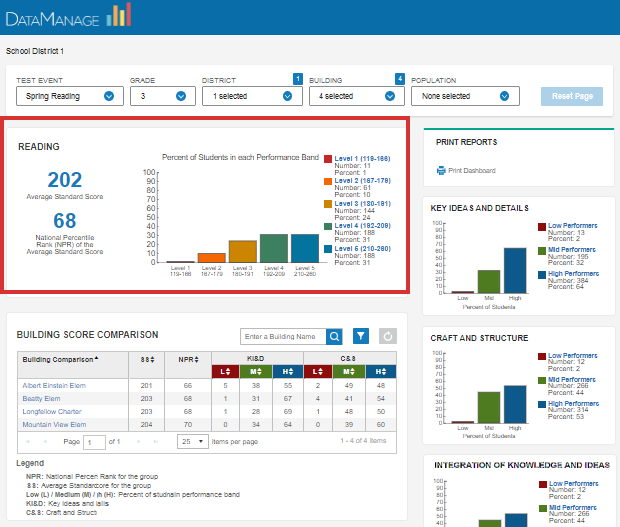
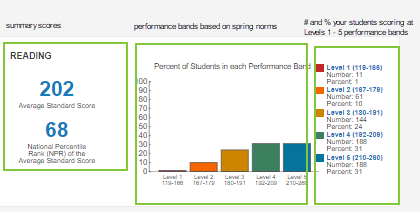
The summary performance display shows the group scores for a test event that meets the specified filters in the row above. All students who completed the test event are included. The average Standard Score (SS) equals the numeric score, averaged, for all of the test-takers in your test event. The National Percentile Rank (NPR) compares the average score of your students to that of the national average and calculates its percentile.
.
The color band bar graph shows the percent of your students (y axis) who scored in each of the five performance-level bands (x axis). Score bands are determined by the most recent norms. (All IowaFlex tests use spring norms. See the IowaFlex Score and Reporting Guide for details about scoring.)
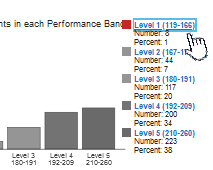
The exact percentage and number of students for each score range are shown to the right of the center graph.
On the test-level performance graph, you can click any of the color bands along the horizontal axis or any of the links to the right of the score bands.
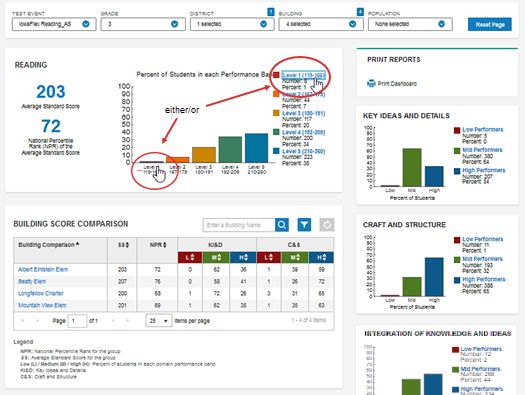
Either action isolates the selected level; all other levels at the performance level change to gray, and the data displayed on the domains and the student roster table apply only to the band you selected.
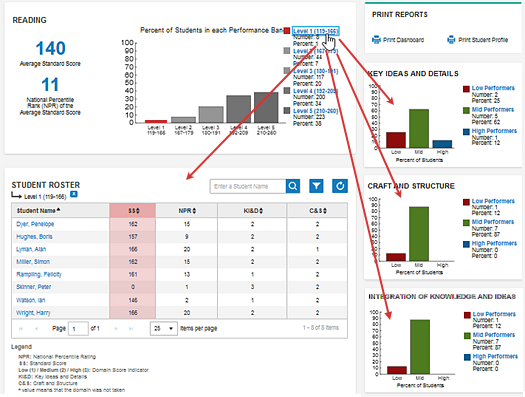
The domain charts, in this example, show the number and percentage of the lowest student test-level scorers in terms of performance on specific measurements of the IowaFlex Reading test (KEY IDEAS AND DETAILS, CRAFT AND STRUCTURE, or INTEGRATION OF KNOWLEDGE AND IDEAS).
The lower left table of the reporting dashboard displays the STUDENT ROSTER for the selected level or group of students (in this case, the lowest scorers on the test as a whole).
Depending on your access level, you might see comparison scores for buildings or classes, which can be clicked to view individual students' scores, or you might see a list of students who fall into a band you selected.
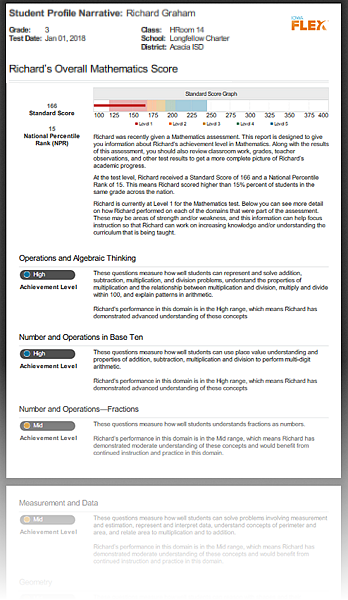
Clicking a student's name from here opens that student's Student Profile Narrative report:
To return to the full range of results on the test-level display, click the selected level again.
Note: Most controls on the dashboard, including score bands and sorting arrows, allow you to toggle by clicking an item a second time.