Dashboard reports show information specific to your product, location, and role. These factors can be configured by the DataManager Account Holder when initiating an account with Riverside Insights® or at any time after.
Variables such as the following determine the scope and content of your view of the dashboard.
● Product = IowaFlex Math, IowaFlex Reading, or CogAT
● Location = System, District, Diocese, School Building, or Class
● Role = System or District Administrator, Principal (Building Administrator), or Teacher
TEST EVENT and GRADE determine the date of the test and grade level of the students. See Filters for more information.
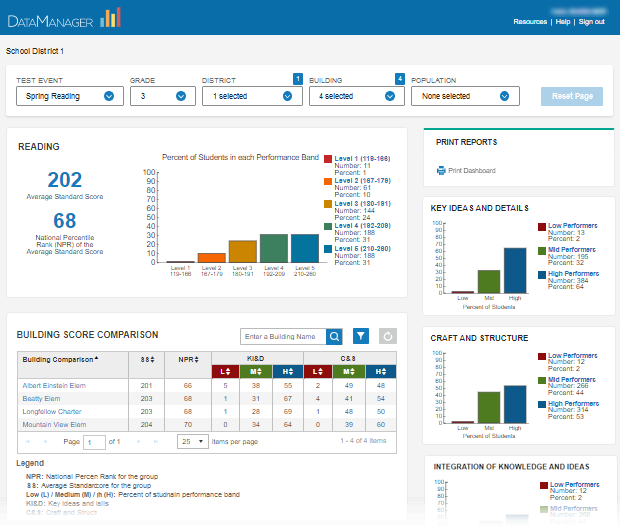
The image below represents the view of a system- or district-level user (role) examining IowaFlex Reading scores (product), including four buildings from one district (location).
See more about dashboard components in this online help, or, for IowaFlex, go to the product page description on the Riverside Insights® home page, where you can read about the highlights of the dashboard and link to an interactive demonstration.
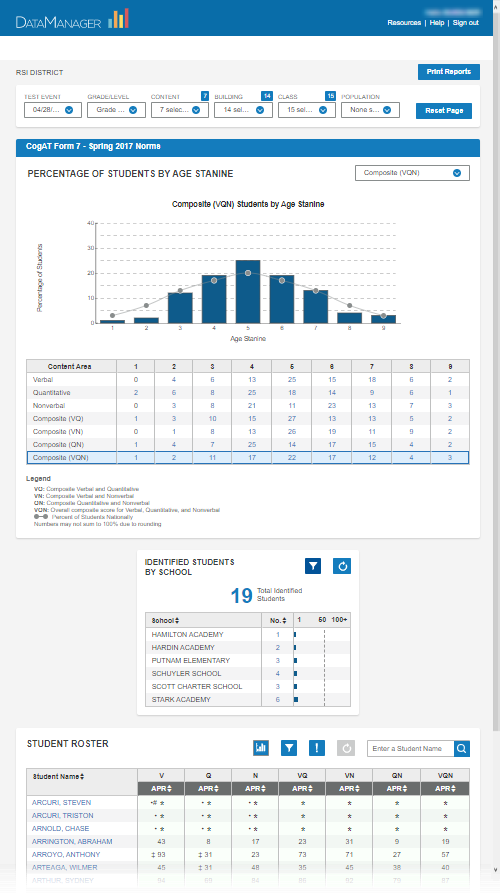
The image below represents a CogAT (product) dashboard as viewed by a district-level user (role) collecting data from 15 classes within 14 buildings (location). 19 students from six school buildings meet the cut score requirements. The entire district roster appears in the bottom portion of the page.
Note: The layout below shows a responsive view for users with limited screen width; the cut score table identifying students by school or class, typically placed to the right of the stanine bar graph and table, appears below that section and above the roster section. A similar shift is used for variations of the CogAT dashboard and for the IowaFlex dashboard and Longitudinal Reports.