The IowaFlex dashboard presents a single, interactive web page comprising one row of filters and three interdependent areas of display:
● A summary (upper left) with five performance bands represented in a color-coded bar graph that shows the Average Standard Score and National Percentile Rank of all students who have completed an assessment.
● A set of two or more graphs (right column of the page, or appended to an additional row at the bottom of the dashboard for display on smaller screens) that categorizes student scores by subject domains..
● A comprehensive table (below the summary) that arranges all comprehensive and domain-level scores by building, class, or student. The student-level view links student names to printable Student Narrative Profile reports.
Additional features on the dashboard include a legend of abbreviations below the comparison/roster table. Only those scores, levels, and domains that appear on the table headers have entries on the legend.
A Print Reports section above the domains allows you to print the current dashboard view at any time. When you have drilled down to a STUDENT ROSTER table (see bottom image on this page), you also have the option to Print Student Profile, which opens a list of all the students in current roster and allows you to print Student Narrative Profile reports for all or some at one time.
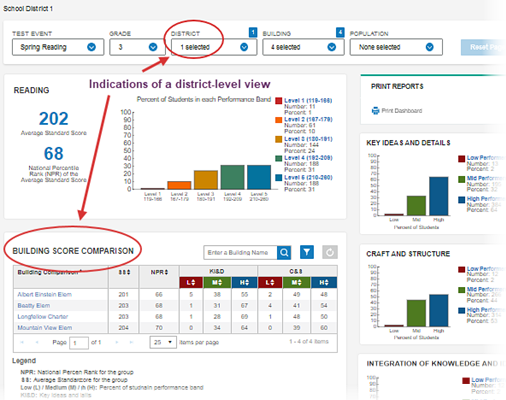
The dashboard opens to an initial view that is determined, in part, by your location and role within the DataManager platform. The image below shows access to a district location, which is typically associated with the DataManager Administrator or Account Holder role.
Selections you make on the performance bands refresh the correlating data in the other areas of the dashboard. If, for example, you sign in to the dashboard and click the mid-range band on a summary report, all other bands become inactive and turn gray. The average scores for domains are re-calculated to account for only those students who scored in the middle range in overall scores (SS and NPR). These new selections and distributions are reflected in the STUDENT ROSTER table, which replaces the BUILDING SCORE COMPARISON and the CLASS SCORE COMPARISON tables. The STUDENT ROSTER table allows you to click a student's name to produce that student's profile narrative report.
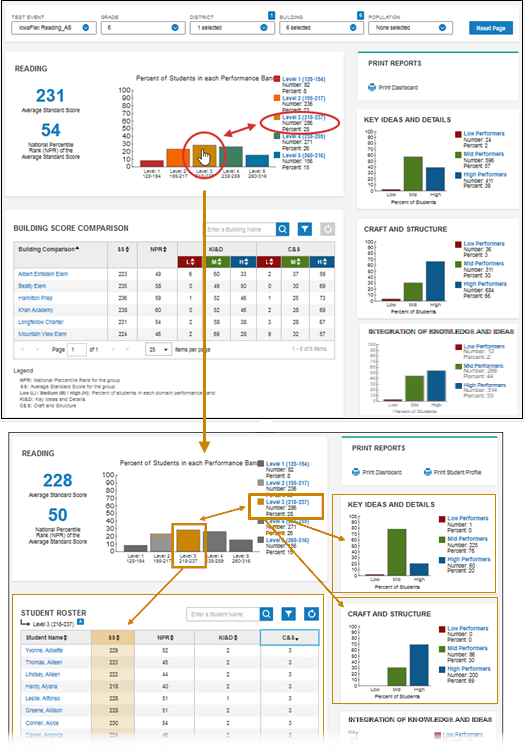
For further analysis, you can use the newly calculated STUDENT ROSTER table to sort level-3 students by a domain classification such as those who also scored in the high range for CRAFT AND STRUCTURE.
More on filters
More on the data displays