Below the filters, the dashboard displays three areas of detail:
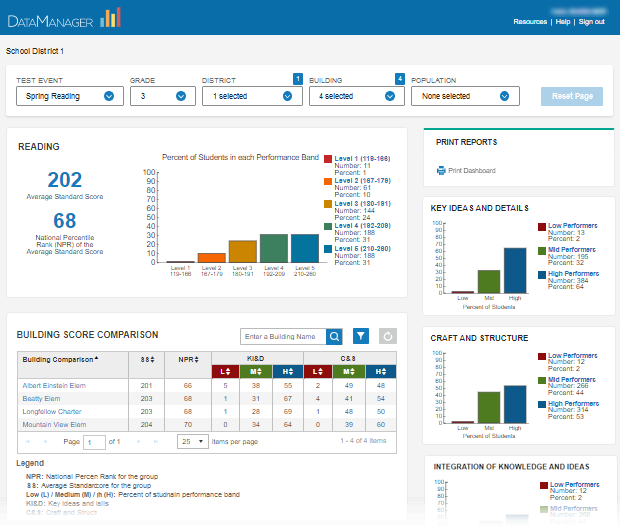
● The summary (upper left) posts average standard scores (SS) and national percentile ranks (NPR) for all students, presents a five-level performance band based on student performance on SS, and displays a performance band key detailing the number and percent of students who score in each level. Selecting a single band or level in this area causes the scores and data to change in other areas of the dashboard, while selections in other areas cause the values in this area to change to reflect a different scope or subset of students. For detailed information about this area and how to use it, see Summary performance.)
● Subject domains (right column below PRINT REPORTS) break down the summary scores into domains measured by targeted questions in IowaFlex reading or mathematics. Three levels for each domain display the distribution of student scores. Selecting any of the bands causes the dashboard to reconfigure its summary score bands and BUILDING/CLASS SCORE COMPARISON or ROSTER area (below the summary) to reflect only those buildings, classes, or students selected in the band. For detailed information about this area and how to use it, see Domains.
● The itemized data in the lower-left area of the dashboard compares the summary and domain-based scores of schools, classes, or students, applying filters and selections you have made in the other sections of the dashboard. If this itemization of scores is at the student level, clicking the name of the student opens that student's Profile Narrative Report. For detailed information about this area and how to use it, see Locations and rosters, including the drop-down selections for each type of data.